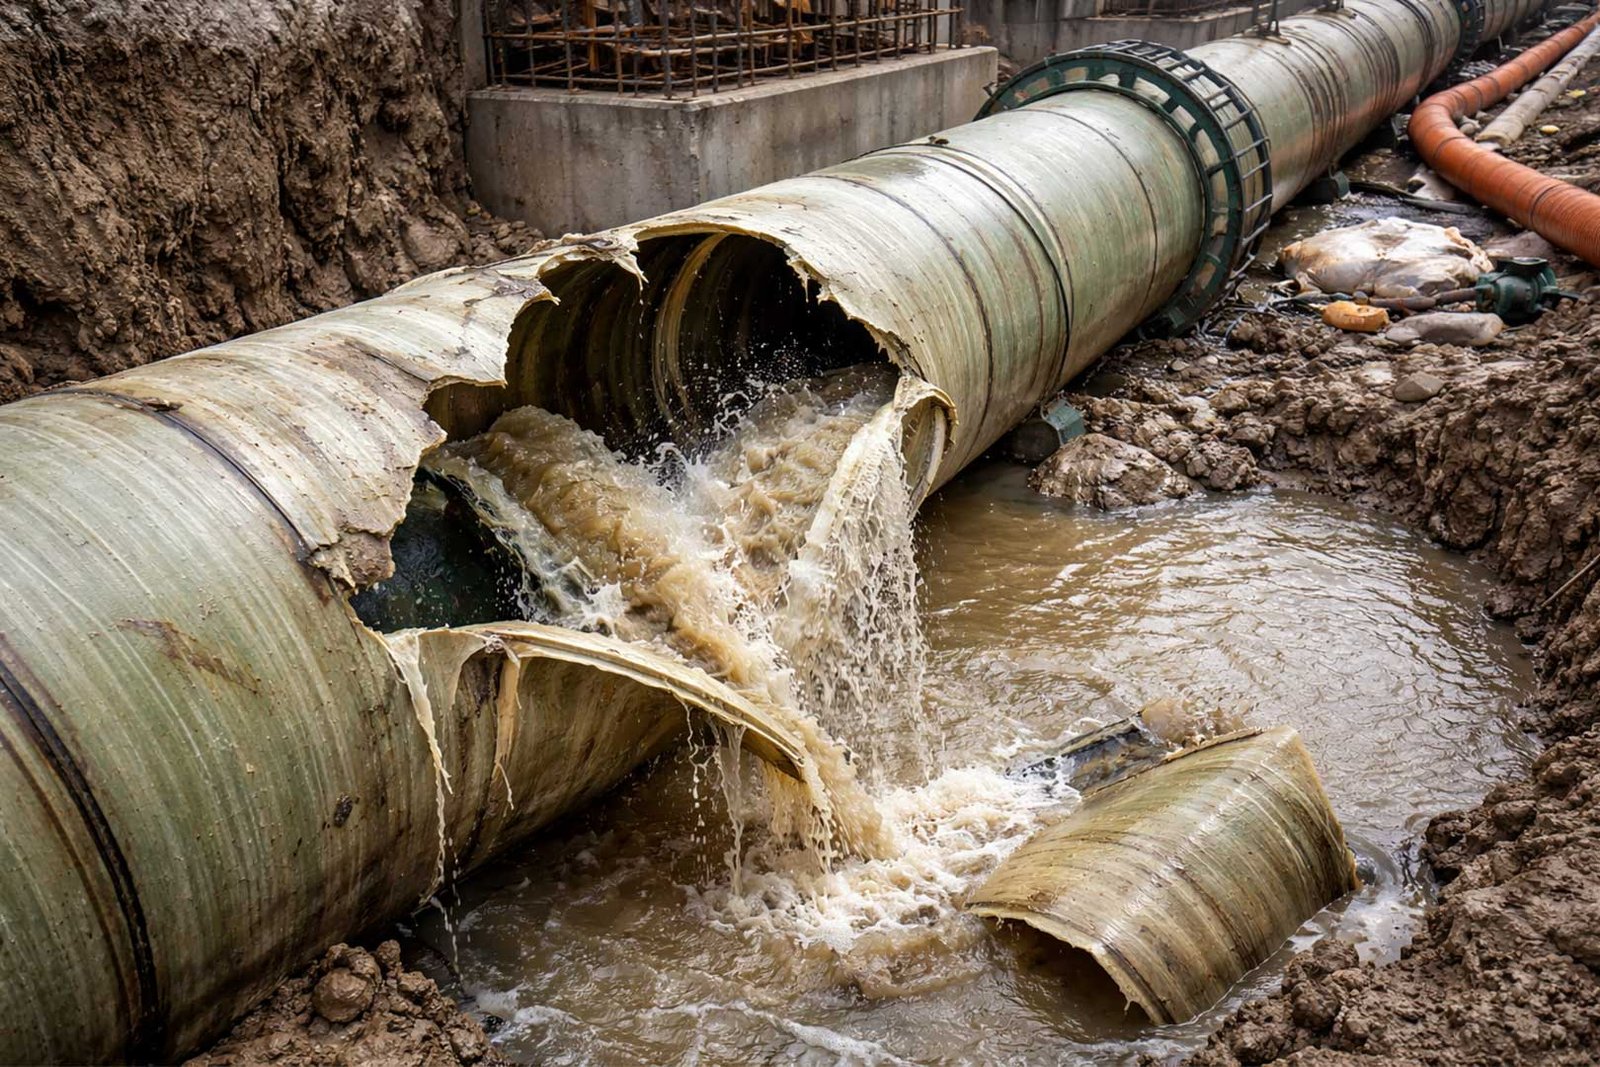
The market of GRE (Glass Reinforced Epoxy) pipes has changed to become a part of the top-tier piping choices for oil and gas, water infrastructure, and chemical lines. As of 2024, the global GRE pipe market is valued at approximately US$2.1 billion. This demand comes from their high performance, durability, corrosion resistance, and other strengths compared to alternatives. GRE pipes surpass steel or HDPE pipes by their higher resistance to harsh chemicals and higher strength-to-weight ratio under heavy loads.
Check the table below that shows the outlook, CAGR rating in 2026-2030, and the market size of each region by 2030.
| Forecast Outlook | CAGR | Market Size by 2030 (USD) |
|---|---|---|
| Global Market | ~5.3% | $2.85B |
| North America | 3.2% | $0.80B |
| Asia-Pacific | 6.8% | $0.85B |
| Middle East & Africa | 8.4% | $0.63B |
This article looks over the GRE pipe industry’s growth, previous trends, competitive forces, and some reliable predictions for tomorrow. It also includes how GRE pipes fit in infrastructure projects and industrial use cases from 2026 to 2030.
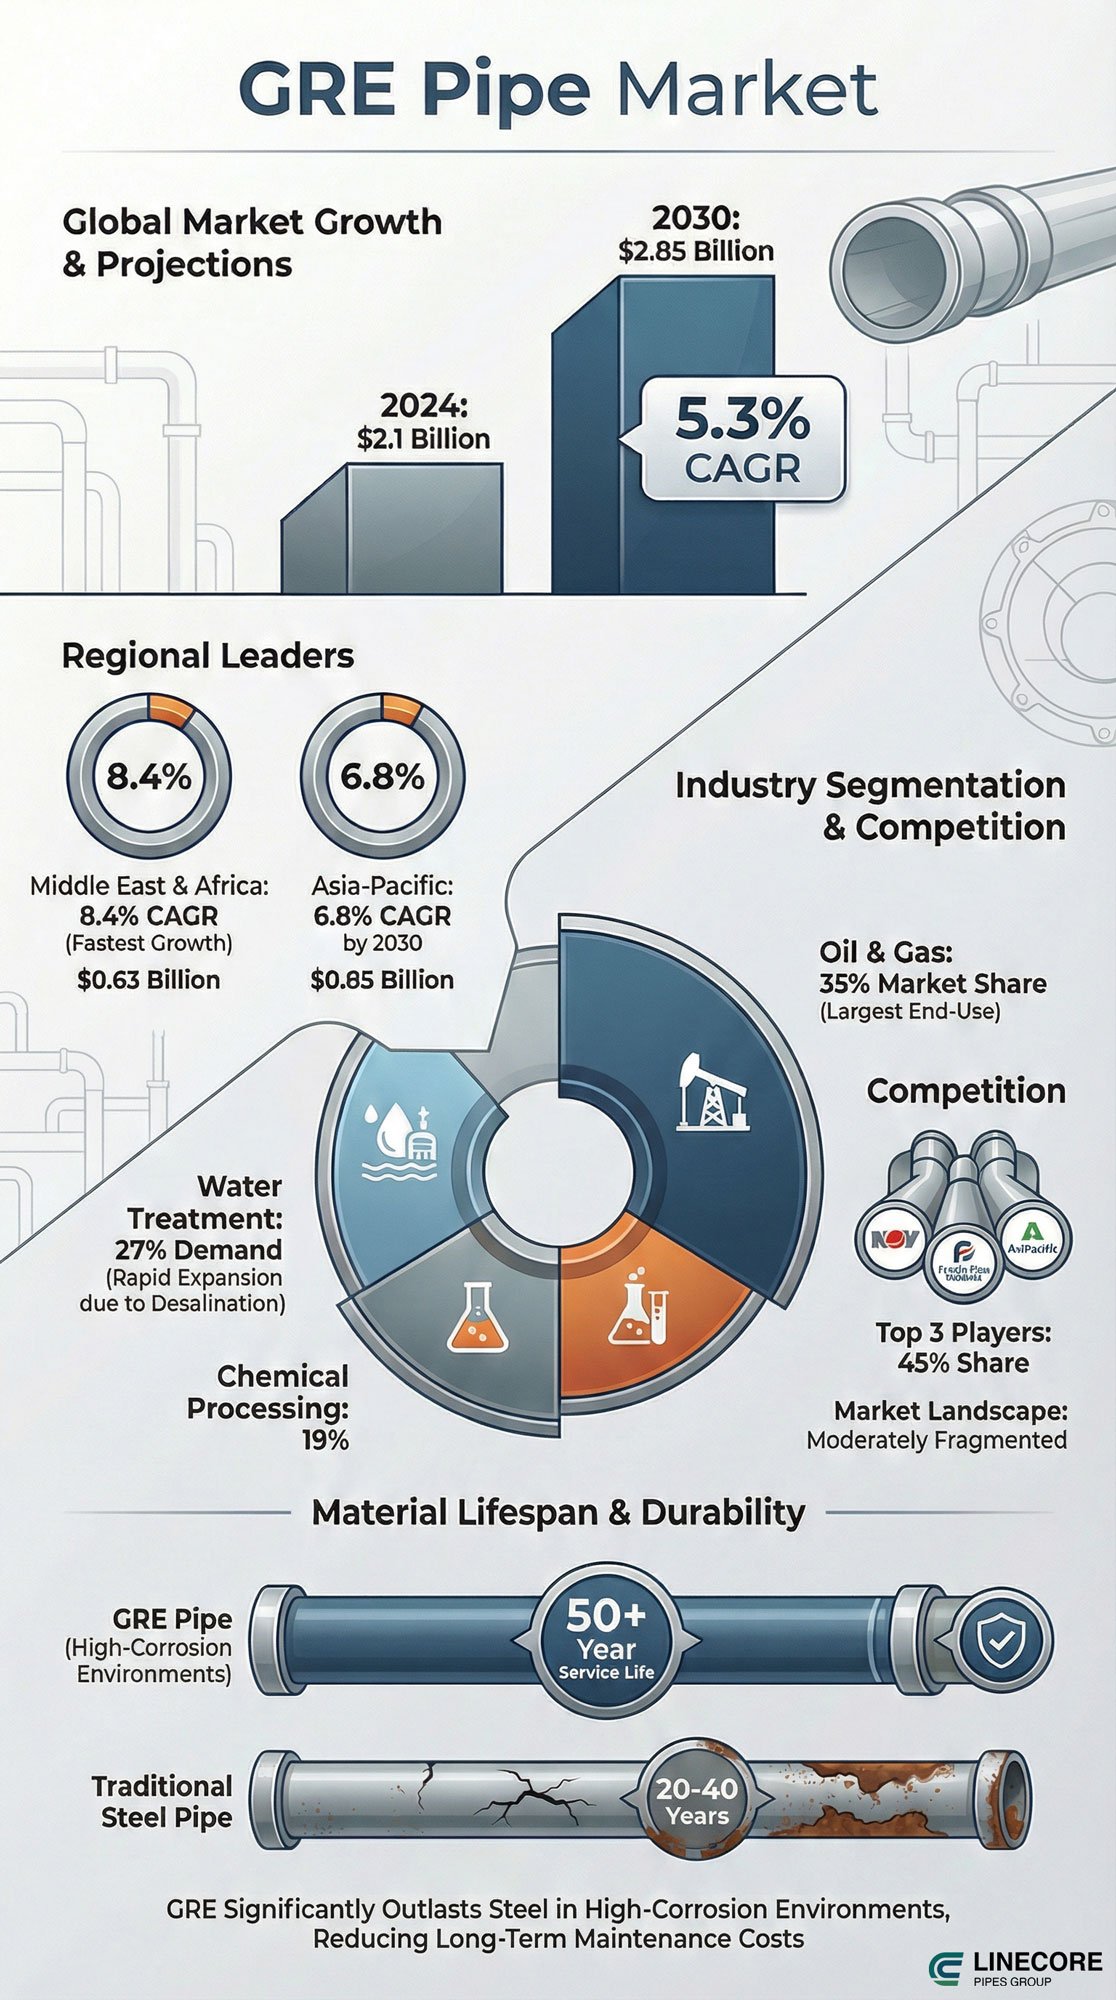
GRE Pipe market infographic (source: Pipelinecoregroup.com)
An Overview of the GRE Pipe Market
In the first section, let’s dive into the exact meaning of GRE and why engineers choose this pipe for projects. These pipes are the best choice among the FRP pipe family due to their high performance. Let’s answer the questions below to be prepared for the rest.
What Are Glass Reinforced Epoxy (GRE) Pipes?
Glass Reinforced Epoxy (GRE) pipes are made of glass fibers and epoxy resin. The choice of epoxy provides such resistance to high- temperature and pressure systems, especially in oil and gas plants.
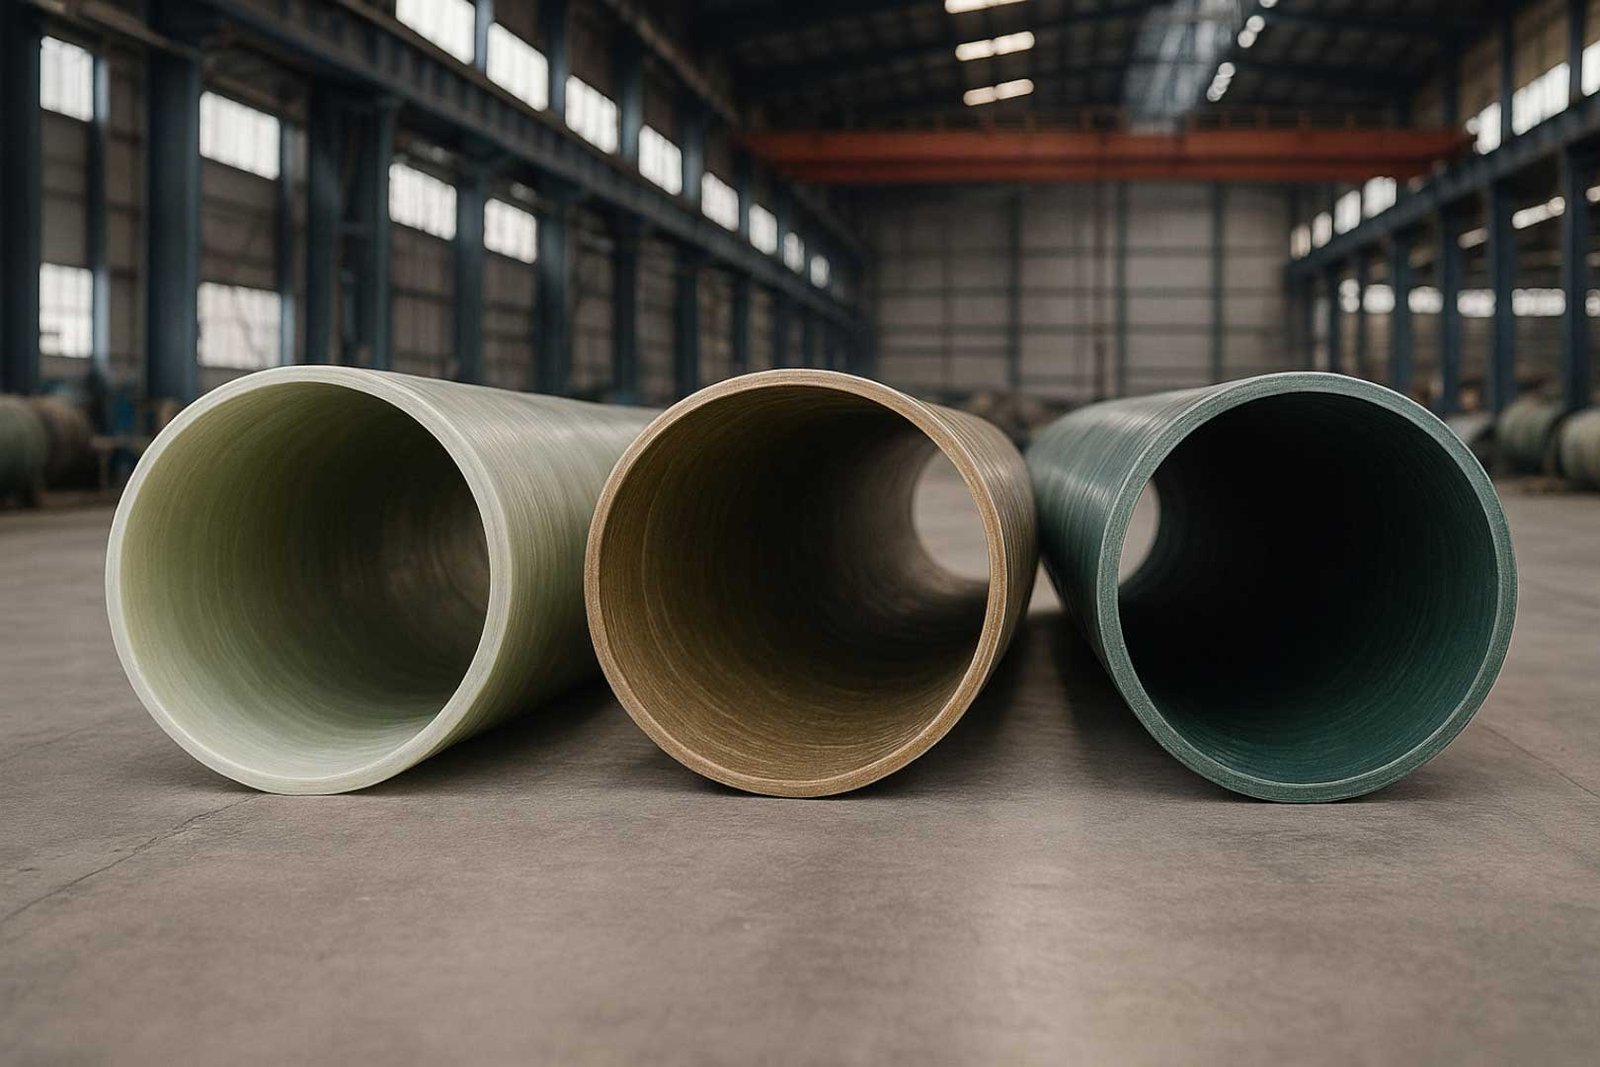
What’s the Position of GRE Pipes among All Composite Pipes (FRP, GRP, and RTRP)?
GRE pipes surpass their family members due to their resin type. Epoxy made a shield that protects pipes from what polyester is used in FRP or GRP, which has failed. That’s where GRE pipes shine and make such a difference!
What characteristics force the Adoption of GRE Pipes in the Market?
The resistance of GRE pipes roots in their structure and material choice. They shine for their:
- Corrosion resistance: GRE pipes show higher resistance to harsh chemicals, acids, and saline conditions compared to steel pipes that corrode easily.
- Lightweight: A higher strength-to-weight ratio is why GRE pipes are top choices for deep burials with no deformation during their lifetime (Source: Scribd).
- Stability: GRE pipes are more stable than steel ones under pressure or extreme temperatures without breakdown.
- Long Service Life: All properties above lead to a long-lasting piping system over 50 years.
- Maintenance Costs: This is another situation where GRE pipes pass steel pipes, where hard-to-access or underwater lines require pipes with lower maintenance requirements.
GRE vs GRP vs Steel vs HDPE
Check the table below to achieve the core differences of these pipelines at a glance.
| Aspect | GRE Pipes | GRP Pipes | Steel Pipes | HDPE Pipes |
|---|---|---|---|---|
| Corrosion Resistance | Excellent; handles acids/salts without protection | Good for mild; weaker in extremes | Poor; needs coatings/protection | Good in non-aggressive; degrades in acids/heat |
| Strength-to-Weight Ratio | High; ~25% steel weight | High; slightly less robust | Low; heavy, high transport costs | Moderate; flexible but lower strength |
| Thermal Stability | Up to 120°C | Up to 80°C | High (200°C+) | Low (60°C); softens |
| Service Life | 50+ years | 30-50 years | 20-40 years | 50 years; UV-sensitive |
| Initial Cost | High (1.5-2x HDPE) | Moderate | Low-moderate | Low |
| Market Substitution | High-pressure oil/gas; replaces steel offshore | Water/sewage; mild corrosives | Traditional; substituted in corrosion areas | Flexible lines; replaced in pressure/chemical apps |
Global GRE Pipe Market Size & Forecast
This section goes beyond the current market size of GRE pipes. It started with a historical view, carried on to a forecast, and ended up with a growth trend in an annual perspective.
1. The History of the GRE Market
Back in 2020, when the market sat at $1.7 billion, it experienced a shift to $2.1 billion by 2024 (Source: Market Trends Analysis). This shift came from the post-pandemic recovery of water infrastructure and energy plants. Project managers tend to replace outdated steel pipes with modern alternatives like composite pipes, with a growth rate of 4-5% annually.
2. The Current Market Situation
What has made this much growth in the last five years for GRE pipes stems from their highly resistant material and structure. This market is projected to be around $2.32 billion in 2026.
The biggest share is for pipes and fittings in oil, gas, and desalination systems, mainly in the Middle East, where modern projects require long-lasting pipes like GRE.
3. Prediction for the Market
If things keep going the way they are, the basic case will raise the number to $2.85 billion by 2030 and maybe even $3.5 to $4 billion by 2035. This is mostly because of new water infrastructure and the switch to green energy.
4. The Absolute Dollar Opportunity
That means more than $500 million in new income by 2030, largely from big projects in the Middle East and growth in Asia-Pacific.
5. Year-on-Year Growth Trends
Look for 5% jumps in 2027, then 5.5% or so through 2029, with spikes tied to big desalination rolls and oil field upgrades.
6. Scenario Analysis
Conservative paths see slower climbs to $2.6 billion by 2030 if costs bite hard; base holds at $2.85 billion with steady demand; aggressive hits $3.16 billion on fast water and hydrogen adoption.
Market Dynamics of GRE Pipes
Once the surrounding environment of the GRE market and its position in the global market are defined, it’s time to look over the market through an analysis similar to SWOT, but in the case of drivers, restraints, opportunities, and challenges of this market over the years.
Market Drivers
Main drivers segmented by what GRE pipes are best at. For instance, due to the use of epoxy resin and reinforced glass fibers, they’re more likely to last in aggressive situations. Other drivers include:
- Steel gets corroded fast in sour crude or salty spots. GRE slashes downtime and repair costs big time.
- Deepwater and subsea lines face crushing pressure and cold. GRE handles it without the extra weight.
- Middle East desal plants pump harsh brine for years. GRE shrugs it off reliably.
- Factories with acids or hot chemicals avoid leaks and shutdowns by using GRE.
- Steel’s cheaper upfront, but GRE wins long-term: almost no maintenance, no corrosion checks, better flow, lower energy bills (ScienceDirect).
Where are the limitations of the GRE market
Despite the remarkable strength of using GRE in modern piping systems, the GRE market contains such restrictions that require a preventive solution for a durable lifespan.
Once you’ve chosen the GRE for your project, it seems a bit more expensive (because of the high price of resin and glass fibers) than steel pipes. But the truth behind it is that GRE lasts longer than steel and requires less maintenance, which makes GRE more affordable in general.
GRE pipes are truly lighter than alternatives, which makes them a bit more demanding in terms of careful handling and the installation process.
Cheaper options like HDPE flex better for simple jobs that take the share where pressure’s low.
Opportunities vs Challenges in the GRE Pipe Market
Every pipeline includes strengths and opportunities in the market to be chosen for projects. Meanwhile, they may show some flaws or face challenges, so considering them is the first solution to avoid failure. Check the table below for golden tickets and dark sides of GRE pipes.
| Category | Point | Description |
|---|---|---|
| Market Opportunities | Fresh ground to grab | Plenty of new markets open. |
| Hydrogen & Carbon Capture | Green energy needs H2-safe pipes. GRE fits grids. | |
| Water Infrastructure Modernization | Billions upgrade water networks. GRE suits long lines. | |
| Localization & Regional Manufacturing | Saudi pushes local builds. Firms win nearby. | |
| High-Pressure & High-Temp Niche | Extreme wells/plants need custom GRE. | |
| Market Challenges | Tough hurdles remain | Obstacles slow progress. |
| Qualification & Certification | API/ISO approvals delay big bids. | |
| Lumpy project-driven cycles | Mega-projects cause long gaps. | |
| Regulatory & compliance complexity | Country rules delay rollouts. |
Next section is the core part of paper that divides the market into pieces by subcategorized factors.
GRE Pipe Market Segmentation Analysis: From Product Types to Use Cases
The GRE pipe market can be segmented by several types of categories, such as diameter size, pressure rating, product type, applications, or end-use industry cases. Check tables and subsections below to find those hot spots your GRE pipelines fit.
Segmentation by Type of GRE Pipes, Diameter Size, and Pressure Ratings
GRE pipes include several types, diameter sizes, or PN that each can be used in specific use cases. Each region mainly uses GRE for one or two applications. Here we provide a table that includes all values, where changes in each can lead to a different share in the market.
| Category | Sub-Type | Characteristics | Market Share (2026 Est.) | Growth CAGR (2026-2030) | Key Uses |
|---|---|---|---|---|---|
| Product Type | Standard GRE Pipes | Corrosion-resistant, moderate strength, up to 16 bar | ~40% | 4.5% | • Municipal water
• Basic wastewater |
| High-Pressure GRE Pipes | High-strength filament-wound, up to 3000 psi | ~35% | 6.0% | • Oil & gas transmission
• Offshore lines |
|
| Specialized/Custom GRE Systems | Rigid/spoolable, liners, anti-static for extremes | ~25% | 5.5% | • Chemical processing
• Extreme environments |
|
| Diameter | Small Diameter | <300 mm, lightweight, easy install | ~30% | 4.8% | • Urban distribution
• Chemical feeds |
| Medium Diameter | 300-1200 mm, balanced strength | ~40% | 5.8% | • Industrial sewage
• Mid-size transmission |
|
| Large Diameter | >1200 mm, high-volume flow | ~30% | 5.2% | • Desalination mains
• Long-distance water |
|
| Pressure Rating | Low Pressure | <20 bar, basic epoxy | ~25% | 4.0% | • Municipal water
• Basic wastewater |
| Medium Pressure | 20-50 bar, reinforced | ~30% | 5.0% | • Chemical processing
• Industrial flows |
|
| High Pressure | 50-100 bar, advanced winding | ~30% | 6.0% | • Oil & gas transmission
• Offshore lines |
|
| Ultra-High Pressure | >100 bar (up to 210 bar), specialized curing | ~15% | 6.5% | • Subsea operations
• Deep wells |
Segmentation by Applications
GRE pipes are used in various applications around the world, from oil and gas pipelines to water systems. Follow the points below and their predicted share of each.
- Oil and gas take the first place and own the biggest share in global uses of GRE pipes by 30% of the market. (Source: MarketResearchFuture)
- Offshore and subsea pipelines take one-fifth of the market for their rigs and water transmission lines.
- Chemical processing and water infrastructure each account for 15% of the global share of their acid, water, sewerage, or other fluid transportation.
- In the next positions, desalination with 10% in big MENA, firewater systems with 5%, and industrial process lines with the last 5% design a GRE piping system in factories and beyond.
Check the table below that shows the share of each end-use industry in the case of the GRE pipe global market shares.
| Industry | Share (2026) | Growth Trend |
|---|---|---|
| Oil & Gas | 38% | Steady replacements |
| Petrochemical | 10% | Chemical booms |
| Chemical Processing | 18% | Harsh media |
| Power Generation | 8% | Cooling lines |
| Municipal Water Infrastructure | 15% | Upgrades |
| Marine & Offshore | 5% | Ballast systems |
| Industrial Manufacturing | 6% | Process tweaks |
Regional Market Analysis of GRE Pipes
There’s an analysis method for the GRE pipe market segmentation that includes regional shares, from the biggest one as world leaders to the smallest ones.
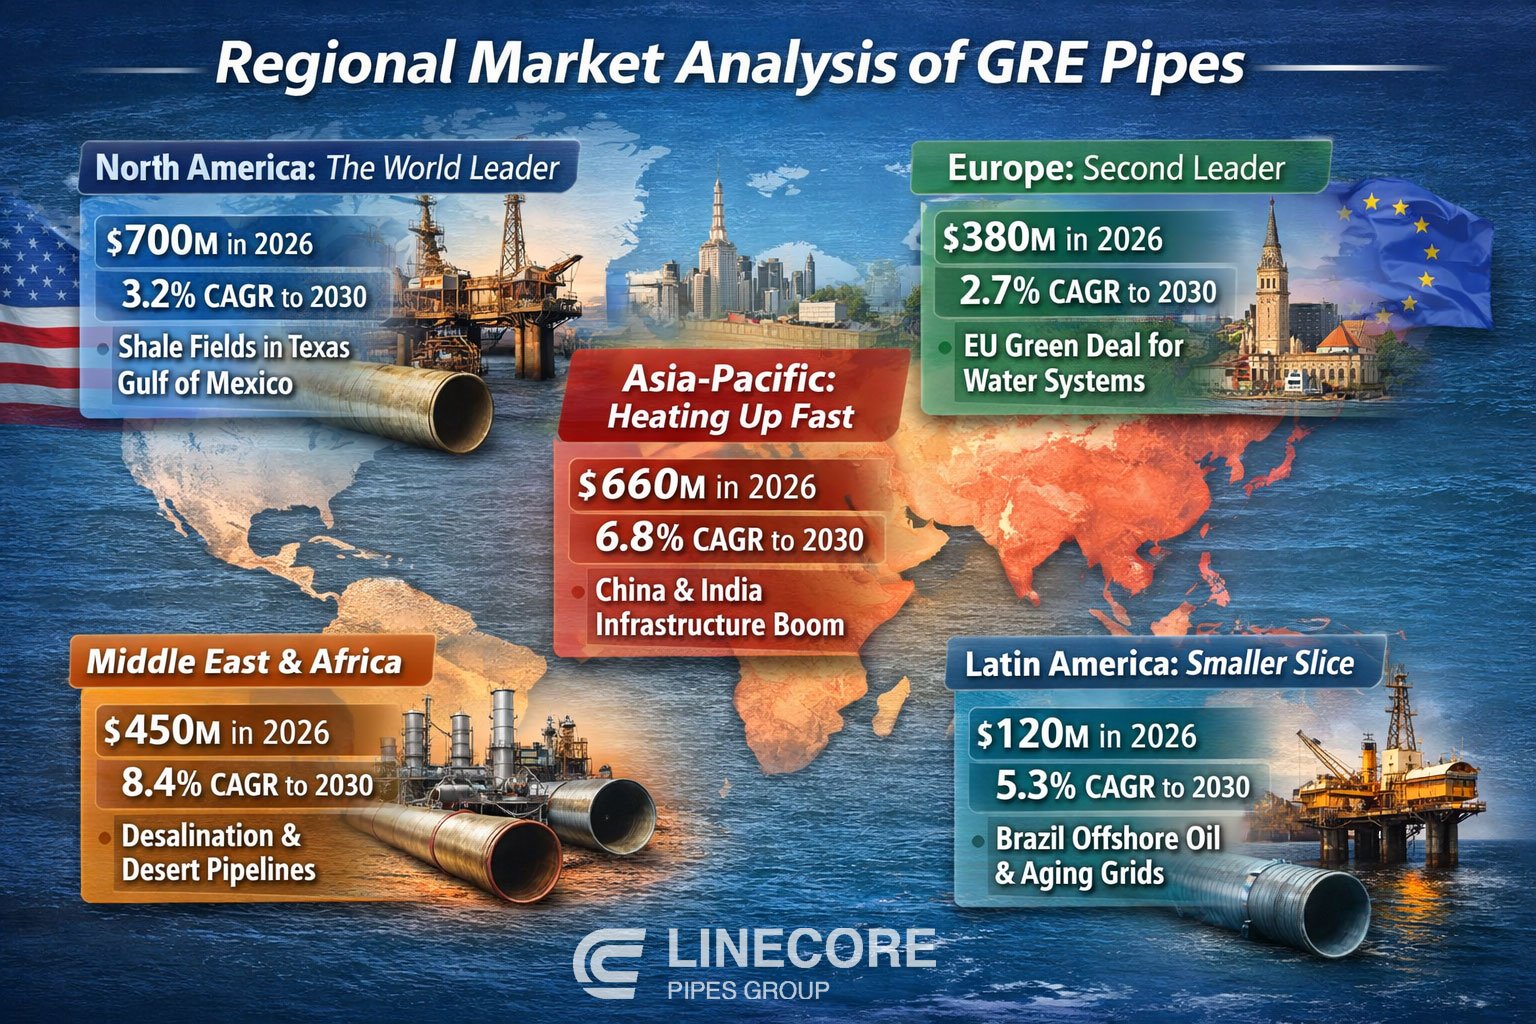
North America: The World Leader
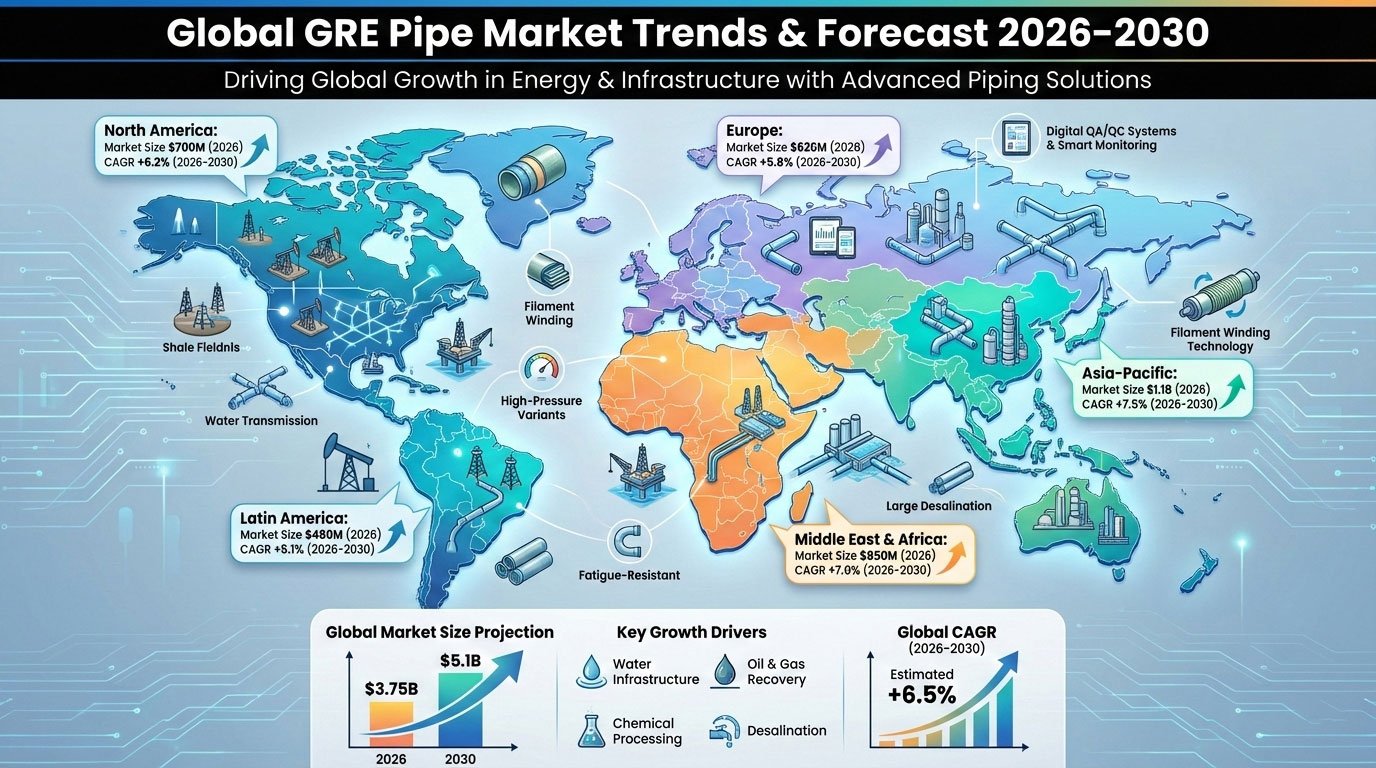
North America has the biggest share among all regions. As noted in Grand View Research, this market is projected to be about $700 million in 2026 with a CAGR of 3.2% a year to 2030. This usage goes through two main offshore platforms:
- Shale fields in Texas
- Gulf of Mexico
GRE pipes are the best option for offshore plants due to their corrosion resistance in salty environments.
- Note: EPA rules force corporations with strict rules on emissions and water that make such an opportunity for composite pipes over steel ones.
Europe: Second Leader
With a CAGR rate of around 2.7% and $380 million in 2026, they are likely to reach $476 million for outdated water systems.
The EU Green Deal is pushing contractors forward to greener choices for projects. The GRE with a low rate of failure and need for repair is the best option.
Asia-Pacific
This is where things are heating up fast: $660 million in 2026 and a solid 6.8% CAGR. China and India are building factories, power plants, and city water networks, and GRE keeps showing up because it doesn’t leak and handles chemicals well.
- Insights: Big Chinese manufacturers also keep prices competitive and make exporting pretty easy.
Middle East & Africa
The regions are at $450 million in 2026 and growing quickest, 8.4% a year, due to oil money in Saudi Arabia, the UAE, and a few others. Giant desalination plants eat up GRE for brine lines, and those long desert water pipelines would chew through steel in no time.
- Technical Insight: Saudi Arabia’s Vision 2030 is pushing local factories too, so supply chains are getting shorter, and jobs are staying close to home.
Latin America: Smaller slice
$120 million in 2026 with 5.3% growth. Brazil’s deepwater oil projects are the big story right now. Those harsh offshore conditions scream for GRE.
Meanwhile, Mexico and Argentina are slowly modernizing tired old water and sewage grids by replacing failing pipes with stuff that actually holds up.
At the country level, there are multiple opportunities for each to reach the highest rate of GRE usage in their piping systems due to the practical properties GRE pipes provide for them over the decades of their lifetime.
| Country | Demand Drivers | Key Industries | Infrastructure/Projects | Competitive Landscape |
|---|---|---|---|---|
| United States | Pipeline modernization, enviro regs, sustainable push | Water/wastewater, oil & gas | Aging metallic replacements, public/private upgrades | Dominates NA; Future Pipe, HOBAS |
| China | Govt urban infra, water/energy investments, urbanization | Oil & gas, chemicals, water treatment | Major water systems, energy projects | Large local players; Graphite India |
| India | Rapid urbanization, durable infra needs | Oil & gas, water/wastewater, industrial | Water treatment, sewage, energy investments | Graphite India leads in GRP |
| Saudi Arabia | Oil & gas, water treatment; harsh environments | Oil & gas, water treatment, mining | Aging infra upgrades, industrial expansion | Saudi Amiantit; Vision 2030 alignment |
| UAE | Desalination, corrosion resistance | Desalination, oil & gas | Port expansions, offshore/marine infra | Saudi Amiantit, Future Pipe |
| Brazil | Offshore oil & gas, lightweight/corrosion-resistant | Oil & gas, marine | Offshore platforms, firewater systems | Future Pipe Industries |
| Germany | Industrial infra, sustainability, aging replacements | Chemical processing, water treatment | Pipeline upgrades, sustainable initiatives | Leads Europe; HOBAS Pipe |
The Competitive Landscape of GRE Pipe Market
There isn’t a lot of competition in the GRE pipe industry. A few global leaders have a big share, but regional experts are what make competition and new ideas happen.
World Leaders and Important Players
- NOV: The clear leader in oil and gas, especially high-pressure GRE solutions for offshore and subsea applications.
- Future Pipes: A major player in the Middle East and Asia, with a wide range of products and services for the energy, water, and industrial sectors.
- Amiantit: Strongly positioned in the Gulf and Saudi Arabia as a regional powerhouse thanks to localization plans and big desalination contracts.
- Amiblu: Brings European engineering know-how to the table, focusing on long-lasting GRE and GRP systems for water infrastructure and industrial.
- The Hengrun Group: A fast-growing Asian company that makes things at a lower cost for new markets.
Other well-known names are Graphite India, Abu Dhabi Pipe Factory, and a number of smaller or local providers.
Main Strategies
To stay ahead, leaders use several typical moves:
- A lot of money is going into new production capacity.
- Localization collaborations to follow national content rules
- Mergers and acquisitions that are selective based on geography or technology
- Follow API 15HR, ISO 14692, and other certifications to the letter.
- Digital tools and better processes to speed up lead times
The best performers are still the ones with the most technical skills, the strongest regional presence, and the most consistent project delivery.
Technology & Innovation Trends
- Recent advances make GRE pipes tougher, more efficient, and easier to track for demanding energy and infrastructure work.
- Filament winding stays dominant. It ensures precise fiber placement and reliable high-pressure strength. New automation and better epoxy resins cut waste and speed output.
- Manufacturers raise high-pressure and high-temperature limits. Pipes now handle 3000 psi and 95–110 °C for offshore and harsh chemical lines. (Source: Scribd)
- Fatigue-resistant and conductive versions manage heavy cycles and stop static risks. Conductive types use carbon fillers for safe flammable-fluid transport.
- Digital QA/QC and traceability systems add IoT sensors and automated tracking. Real-time checks and API 15HR / ISO 14692 compliance become simple.
These steps improve performance, sustainability, and long-term value.
Cost Structure and Supply Chain
Epoxy resin (usually manufactured from BPA and epichlorohydrin) and glass fiber are the two main raw materials that GRE pipe supply networks use.
- Engineering Note: Epoxy resin costs between 35% and 45% of the total, and its price changes often due to changes in the petrochemical market and problems with supply.
Filament winding and centrifugal casting are the most-used methods to produce GRE pipes. Automated lines now deliver better consistency and faster production.
- Distribution happens in two ways: direct sales to end-users or through EPC contracts for big projects, where contractors manage buying and installation.
- Cost breakdown looks like this: raw materials 65–70%, labor plus overhead 15–20%, profit margin 10–15%.
When resin prices jump around 20%, margins take a real hit. Profitability can drop 4–8 points unless companies raise prices or hedge the risk.
An Analysis of Pricing
There are several crucial aspects in the pricing of GRE pipes, such as size, pressure rating (PN), region of supply, and total cost of ownership, which each can influence the final cost of the pipeline.
| Category | Details | Typical Price Range (USD/m) | Notes |
|---|---|---|---|
| By Diameter & Pressure Class | Small (<300 mm), low pressure | 40 – 80 | Basic uses |
| Medium (300–600 mm), medium pressure | 100 – 180 | Industrial & water lines | |
| Large (>800 mm), high pressure | 250 – 500+ | Offshore & custom specs | |
| Regional Price Differences | Asia | 15–25% lower | Local production advantage |
| North America / Europe | Premium | Compliance & delivery speed | |
| Premium vs Alternatives | vs GRP | 30–60% higher | Better chemical/thermal resistance |
| vs Steel | 20–50% higher upfront | No coatings needed | |
| Total Cost of Ownership (TCO) | GRE vs Steel (20–30 years) | 25–40% savings | Lower maintenance & longer life |
Investment & Growth Strategy
The GRE pipe market will experience continuous growth through 2030. Target the right segments and regions for the best returns.
- high-pressure pipes for oil & gas pipelines and large-diameter ones for desalination and water projects.
- New players enter best with joint ventures, fast API 15HR / ISO 14692 certifications, and niche applications to gain customers’ trust.
- Existing manufacturers grow by adding capacity in hot zones, forming localization partnerships, and using digital tools to cut lead times and improve traceability.
- Strategic ties with EPC contractors and raw material suppliers secure contracts and stabilize costs.
Future Outlook of the GRE Pipe Market
There are several prediction by the previous position of GRE pipes in the global market, such as:
The GRE pipe market looks set to experience growth up to 2030, with revenue of USD 3.5–4 billion by the early 2030s.
A clear share shift moves toward water infrastructure, especially desalination and long-distance transmission, as global water scarcity drives demand.
High-pressure applications gain importance in offshore oil & gas and emerging hydrogen transport lines.
Sustainability and ESG factors push adoption, GRE pipes offer lower emissions over their lifecycle, and no corrosion-related waste.
Long-term, composites like GRE continue to substitute steel in corrosive and remote settings, with substitution rates expected to climb toward 25–30% in key sectors.
Line Core Pipes Group: Your Trusted Supplier of High-Quality GRE Pipes
Are you dealing with many GRE pipe suppliers for your piping project? LineCore Pipe Group stands out as a well-known supplier of high-quality and long-lasting GRE pipelines, which are designed based on your project demands.
Our pipelines can be used practically in oil & gas, desalination, or industrial applications where resistance to corrosion and high tolerance to pressure and temperature are a must! Contact our team for expert support and reliable delivery.
FAQs
1- What is the GRE pipe market size in 2026?
Around USD 2.2 billion globally.
2- Who are the main GRE pipe manufacturers?
NOV, Future Pipe Industries, Saudi Arabian Amiantit, Amiblu, Hengrun Group, and regional players like Graphite India.
3- Is the GRE pipe market still growing?
Yes, expected CAGR of 6–7% through 2030, driven by water infrastructure and offshore energy projects.
about
The Author

Farshid Tavakoli is a seasoned professional in engineering and international trade. Holding degrees in Electrical Engineering, Mechatronics, and a Doctorate in Business Administration (DBA) from the University of Lyon, he also has a strong background in industrial automation and production line technologies.
For over 17 years, he has led an international trading company, gaining deep expertise in commercial solutions tailored to industrial needs. With more than 8 years of active involvement in infrastructure development, he specializes in the supply of electromechanical equipment for water and wastewater treatment plants and transfer projects.
Together with comapny expert team, he now provides consultancy and integrated solutions for sourcing and implementing complex infrastructure projects across the region.